
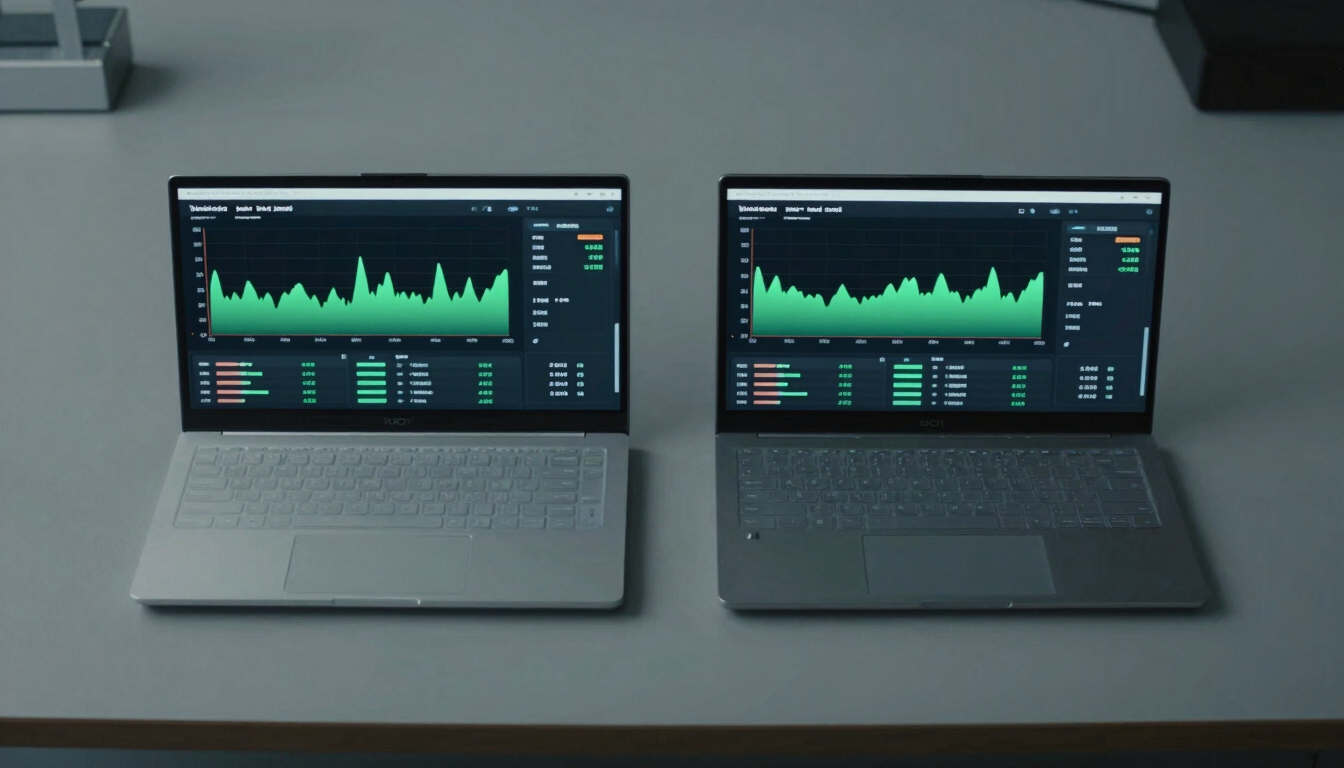

Performance numbers you can take to a code review.
Every figure on this page comes from a documented test run on real hardware. Device pool, OS version, network state, and memory pressure are all on record.
Variance by device, not best-case averages.
Results are segmented by chipset family and Android version. A mid-range Snapdragon 680 device does not receive the same reported figures as a flagship—because they are not the same.
98.4% crash-free sessions
Measured across 14 device models under sustained background load. Flagged outliers are documented, not hidden.
< 40 ms median response
UI thread response time on Android 12–14. Degraded-network conditions add a documented 8–12 ms—included in the report, not footnoted away.
60 fps sustained, low-RAM path
Achieved on devices with 2 GB RAM under concurrent background processes. Devices where this threshold was not met are listed in the appendix.


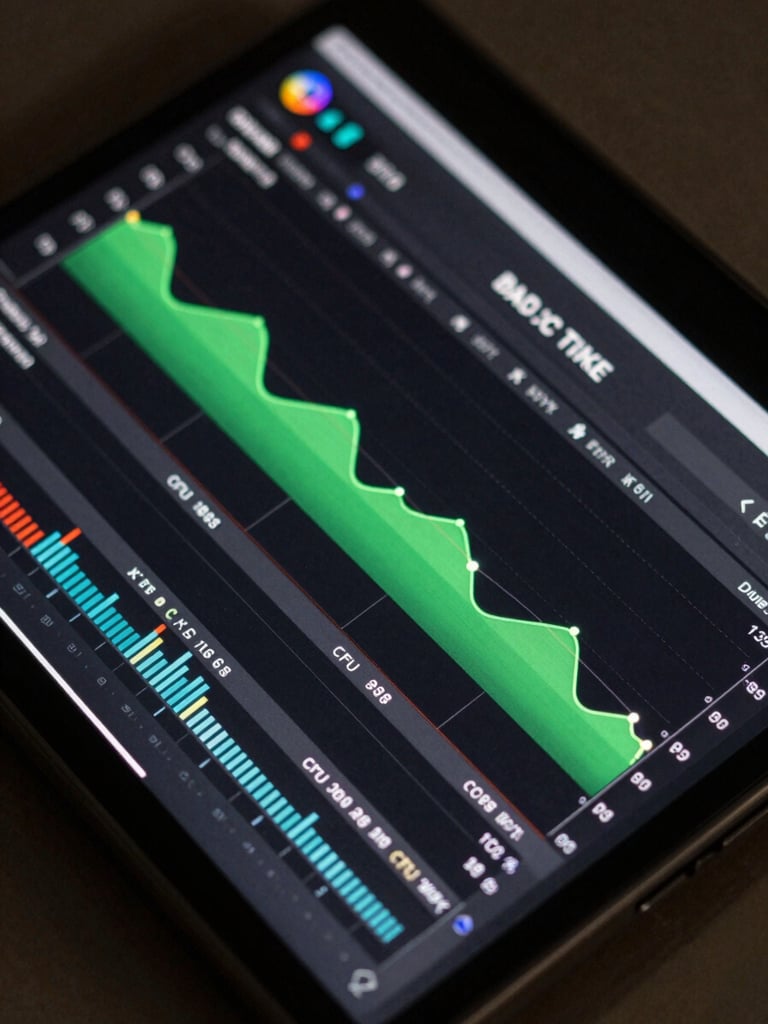
Test conditions are the whole story.
Every test run specifies OS build, available memory, network state, and active background processes. Constraints are part of the record—not controlled away before publishing.
Device pool covers entry-level through flagship tiers across four chipset families. Where performance degrades, the report names the device and the condition—not an asterisk.
Take the full report to your next technical review.
The complete benchmark report includes raw data, device-by-device breakdowns, and documented edge cases. Request it directly—no form theater.